Balance Efficiency and Effectiveness in Software Development
Through a Knowledge-Centric Approach
Introduction
In today’s software industry, organizations face a constant push to go faster, deliver more, and do it with fewer resources. Efficiency often becomes the end goal. But as many engineering managers have experienced, speeding up doesn't always mean moving forward. Features are delivered, but defects rise. Teams move faster, but morale dips. Why? Because efficiency without effectiveness leads to waste, and effectiveness without efficiency leads to burnout.
What we need is a **balanced, holistic view** \- one that sees software development not just as a matter of tasks and timelines, but as a flow of *knowledge*. This article introduces a **knowledge-centric framework** for balancing **efficiency** and **effectiveness** in software development. It complements well-known Flow Metrics with new Knowledge-Centric Metrics, giving engineering managers the tools to both **see clearly** and **act wisely**.
Defining Efficiency and Effectiveness
Let’s clarify the terms:
- Effectiveness is achieving the intended outcomes — focusing on producing meaningful results, delivering value, aligning with customer needs, innovating, not just completing tasks.
- Efficiency is about achieving those results with minimal waste of time, effort, or resources. In software development, efficiency means reducing cognitive effort by leveraging prior knowledge — aligning the team’s skills, experience, and insights with the knowledge required to deliver outcomes.
Efficiency frees up cognitive and organizational capacity, making it possible to invest in innovation and improvement. Effectiveness ensures that your efficiency gains are focused in the right direction.
These two dimensions are complementary. Efficiency is not an end goal but a means to free up resources (time, money, and effort) for higher-value activities like innovation. To achieve sustainable growth, organizations must balance efficiency with effectiveness.
How Efficiency Drives Effectiveness
Efficiency isn’t just about doing more with less—it’s about building quality into the process. Drawing from W. Edwards Deming’s principles, we understand that effective outcomes are a byproduct of well-designed, efficient systems.
According to Deming’s logic, when processes become more efficient, stable, and capable, they lead to:
- Lower variation and waste
- Improved flow of work
- Better outcomes, including:
- Shorter lead times
- Higher throughput
- Fewer defects and escapes
In other words, efficiency improves effectiveness by enabling teams to focus their efforts on meaningful work instead of rework, firefighting, or waiting on dependencies.
This happens because:
- Lead time drops when smoother processes eliminate delays and rework.
- Throughput increases when less time is spent on non-value-added activities.
- Defect rates fall when quality is built into the process, not inspected in after the fact.
Deming emphasized that most performance issues (94%, by his estimate) are systemic, not individual. That’s why improving the system—making it more efficient—is the manager’s most powerful lever for achieving better results.
Striking the Balance
This article introduces a conceptual framework and measurement approach for balancing efficiency and effectiveness in software development. It does not prescribe implementation strategies like leadership behaviors, coaching practices, or organizational change levers. Instead, it defines what to aim for and how to track progress, leaving the “how” of operationalizing the balance for a follow-up or complementary piece.
So, what should leaders do in principle? They must act as stewards of the balance, fostering a culture where effectiveness and efficiency coexist.
A balanced focus:
- Fosters collaboration
- Enhances productivity
- Reduces waste
- Minimizes cognitive load
- Enables developers to consistently reach a state of flow
The key challenge is ensuring that process-level efficiency gains translate into real business-level improvements.
To strike this balance, organizations should:
- Measure both effectiveness and process efficiency
- Design for flow, not just speed
- Streamline processes to make room for experimentation and innovation without overextending resources
- Ensure that efficiency initiatives expand organizational capacity and options for innovation and growth, rather than creating rigidity or bureaucracy
Ultimately, the goal is to build systems and cultures where experimentation, optimization, and sustainable progress can thrive together.
Flow Metrics: Measuring Effectiveness
To measure effectiveness, we look at Flow Metrics - a set of well-known indicators that track how work moves through the system:
- Predictability (Due Date Performance) - The percentage of features delivered on or before their originally committed date. This reflects how reliable and trustworthy the team’s delivery is.
- Defect Escape Rate (DER) - The proportion of defects that were not caught during testing and only became apparent after the product was released. A lower DER suggests a more effective QA and DevOps pipeline.
- Lead Time - The time between when a request is made and when it is delivered to the customer. Lead Time gives a customer-centric view of responsiveness.
- Throughput - The number of features delivered per sprint, month, or quarter. By focusing on features (not stories or points), we reduce the risk of gaming and align with business value.
This perspective treats software development as a Flow of tangible entities from input stages through output to the final user outcome.
They offer a measurable, logistics-like view of software development, highlighting its effectiveness and productivity as if it were a manufacturing system.
These metrics help engineering managers track delivery performance, quality, and responsiveness. But they don’t tell the whole story.
Knowledge-Centric Metrics: Measuring Efficiency of the Process
Software development is fundamentally knowledge work. Every feature delivered requires bridging a gap between what a developer knows and what they need to know. That’s why traditional metrics often fall short - they don’t account for the invisible cost of learning, decision-making, and knowledge flow.
Our approach introduces three Knowledge-Centric Metrics that measure the quality and efficiency of the software development process:
These metrics serve as leading indicators, tracking the quality of the software development process by focusing on its core nature: the acquisition and application of knowledge.
1. Knowledge Discovery Efficiency (KEDE)
KEDE measures how efficiently developers are bridging the knowledge gap between their prior knowledge and the knowledge required to complete a task.
- KEDE values range from 0% to 100%.
- A KEDE close to 100% means the developer is doing routine work—there’s little to learn, but also little challenge.
- A KEDE near 0% means the developer is overwhelmed, possibly working far outside their zone of competence.
- A KEDE around 20% is typical for experienced developers—enough challenge to drive learning, but not so much as to create stress.
KEDE works like a thermometer - it doesn’t tell you what’s wrong, but it signals whether something is off balance.
2. Happiness as Psychological State of Flow
Flow is not just a buzzword; it’s a measurable psychological state characterized by:
- A balance between challenge and skill
- Loss of self-consciousness
- Altered sense of time
- A sense of control and effortlessness
Flow contributes to both productivity and happiness, which are essential for long-term team health.
We use KEDE as a proxy to infer the likelihood of flow:
- KEDE values less than 50 suggest an imbalance leaning towards anxiety, indicative of overly challenging tasks.
- KEDE values over 50 suggest an imbalance towards boredom, where tasks are not sufficiently challenging.
- An ideal state of Flow is indicated by a KEDE value of 50, representing a perfect balance.
When KEDE is in a healthy mid-range, developers are more likely to experience flow - a state of deep focus, intrinsic motivation, and optimal productivity.
3. Rework (Information Loss Rate)
From a knowledge-centric standpoint, rework isn’t just code churn - it’s lost information.
We define rework as:
- Changes to “What” (e.g., feature removals or scope reversals)
- Changes to “How” (e.g., excessive refactoring)
These represent situations where the initial knowledge guiding a decision turned out to be flawed or incomplete. We quantify this through the Information Loss Rate:
Information Loss Rate = Lost Information / Total Perceived Information
A high loss rate indicates process inefficiencies - either poor requirements, gaps in shared understanding, or bad knowledge transfer.
The Power of a Holistic View
What makes this approach powerful is how Flow Metrics and Knowledge-Centric Metrics complement each other. They represent two lenses on the same process:
- Flow Metrics show what’s happening in terms of delivery outcomes.
- Knowledge-Centric Metrics show why it’s happening, by revealing the cognitive and organizational dynamics underneath.
Used together, they give engineering managers a holistic picture of software development - one that goes beyond speed or cost to consider sustainability, learning, and team well-being.
Aggregation and Comparisons
All of these metrics can be:
- Tracked per team (e.g., in retrospectives or sprint reviews)
- Aggregated across teams or departments
- Analyzed over time to guide organizational change
This makes them suitable not only for local improvements, but also for executive-level insight and strategic alignment.
These metrics are used as both team-level diagnostics and organizational performance indicators, enabling:
- Comparison across different contexts, programming languages, and applications
- Department-level trends (e.g., identifying where support or intervention is needed)
- Leadership visibility into how different teams contribute to business outcomes
Reporting Efficiency and Effectiveness Together
To make metrics actionable for engineering managers, it's essential to report both Flow Metrics and Knowledge-Centric Metrics in a unified, easy-to-read format. The example dashboard below shows how this can be done using a visual tracker that groups key indicators by initiative, project, or team.
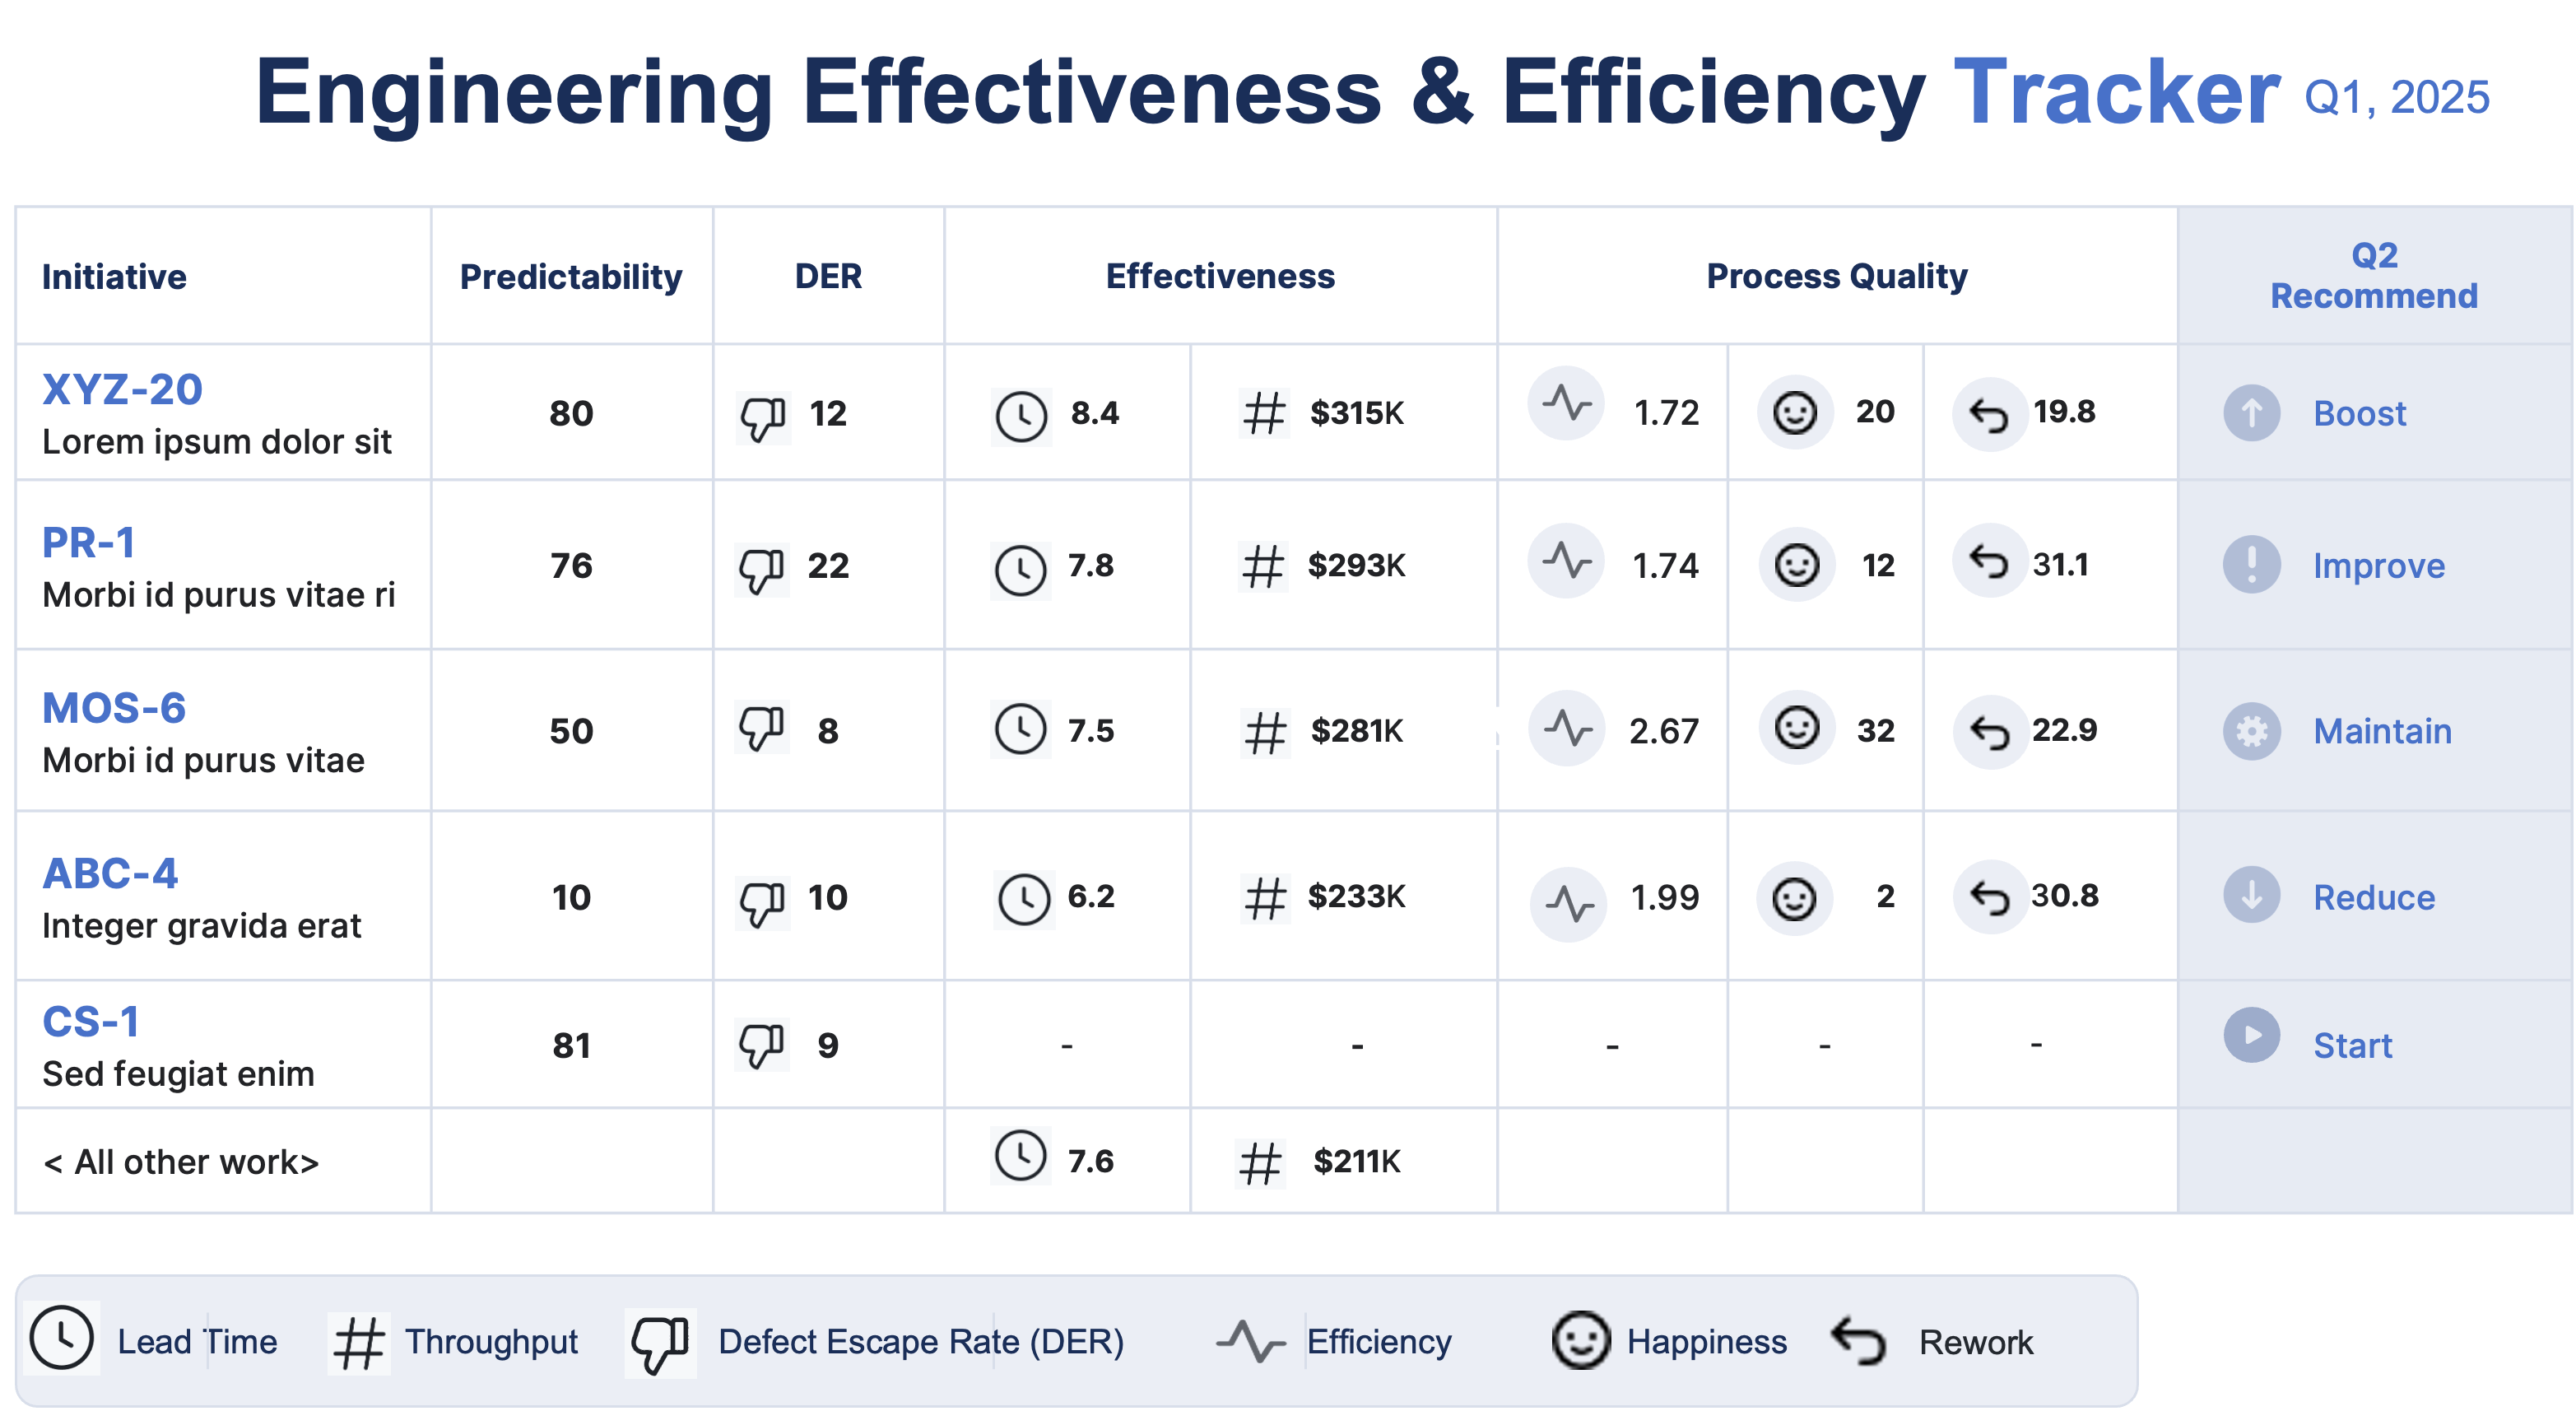
What the Dashboard Shows
Each row represents an initiative or project, allowing managers to compare performance across teams or delivery streams. The metrics are grouped into two main categories:
Effectiveness (Flow Metrics)
These metrics reflect what is being delivered and how reliably:
- Predictability (%) – On-time delivery based on original commitments
- Defect Escape Rate (DER %) – Quality of releases based on post-production defect leakage
- Lead Time – Time taken from request to delivery
- Throughput – Number of features delivered
- Cost Impact – Business value and effort associated with each initiative
Process Quality (Knowledge-Centric Metrics)
These metrics reflect how the work is getting done and the efficiency of knowledge flow:
- KEDE (Efficiency) – How effectively prior knowledge is being applied
- Flow/Happiness (%) – Psychological indicators of engagement and optimal challenge
- Rework (Information Loss Rate) – Percentage of discarded or revised work, indicating waste or misalignment
How Managers Can Use It
This reporting format helps engineering managers:
- Quickly spot outliers (e.g., high throughput but low happiness)
- Investigate why initiatives differ in delivery performance
- Correlate process health with business outcomes
- Decide where to intervene or support—whether through process improvement, coaching, or strategic adjustments
A Unified View for Smarter Decisions
By combining Flow and Knowledge-Centric Metrics into a single dashboard, you offer managers both the outcomes and the underlying process signals. This not only improves situational awareness but helps shift conversations from “why didn’t we deliver?” to “how can we improve sustainably?”
Practical Guidance (Without Tool Lock-In)
We intentionally do not recommend specific tools in this article. The goal is to provide a framework and lens, not a vendor solution.
Engineering managers can use data from:
- Git repositories
- Issue trackers
- CI/CD pipelines
- Team surveys or retrospectives
What matters is not the tooling, but the questions you ask and the conversations these metrics enable.
Final Thoughts: A New Lens
The transformation we’re advocating is this:
Move from viewing software development as a sequence of coding tasks, to seeing it as a flow of knowledge.
With this lens, metrics like KEDE, Happiness, and Rework aren’t just abstract ideas. They become vital signs for your teams and guiding signals for your leadership.
And the beauty of this approach is its balance: Flow Metrics and Knowledge-Centric Metrics don’t collide - they complete each other.
Together, they give you what engineering managers truly need:
- A clearer picture
- A richer understanding
- And a smarter path forward
Summary
This article introduces a knowledge-centric framework for measuring and managing efficiency and effectiveness in software development. It combines well-established Flow Metrics - like Predictability, Lead Time, and Throughput - with new Knowledge-Centric Metrics such as Knowledge Discovery Efficiency (KEDE), Flow (as happiness), and Rework (Information Loss Rate).
By integrating both perspectives, engineering managers gain a holistic view of their teams' performance - one that captures not just what gets delivered, but how work happens and why outcomes emerge. This dual-lens approach enables better decision-making, healthier teams, and more sustainable business impact.

Dimitar Bakardzhiev
Getting started


